
Air Quality Health Index (AQHI)
Learn What It Means for Your Health
The AQHI provides a number from 1 to 10 to indicate the level of health risk associated with local air quality. The higher the AQHI number, the greater the health risk and the need to take precautions. By checking the AQHI, you can stay informed about the current air quality conditions in your area and protect your health.
Low Risk
At-Risk Population
Enjoy your usual outdoor activities.
General Population
Ideal outdoor active weather.
Moderate Risk
At-Risk Population
Consider reducing or rescheduling strenuous activities outdoors if you are experiencing symptoms.
General Population
No need to modify your usual outdoor activities unless you experience symptoms.
High Risk
At-Risk Population
Reduce or reschedule strenuous activities outdoors. Children and the elderly should also take it easy.
General Population
Reduce or reschedule strenuous activities outdoors if you experience symptoms like coughing or throat irritation.
Very High Risk
At-Risk Population
Stay indoors, keep windows and doors closed, and use an air purifier if available.
General Population
Everyone should avoid prolonged outdoor activity. Check on neighbours, older family members, and anyone with a respiratory or heart condition.
Map View
Current Air Quality Conditions
The Live Air Data Map shows current AQHI readings from continuous monitoring stations and hourly average PM2.5 concentrations measured by microsensors. Microsensor readings are displayed using the AQHI colour scale as a visual reference to help you understand potential health concerns.
Live Air Map interface developed and shared by Alberta Capital Airshed
About the Data
Making Sense of Live Air Quality Data
All readings are recorded in Mountain Standard Time. These values generally reflect ambient air quality, but they are raw data. After collection, they undergo quality checks before being stored in the Government of Alberta’s Air Quality Data Management Platform.
Missing or Unusual Readings
If you notice gaps on the map, it means data was not recorded during that period. This often happens during scheduled maintenance or sensor calibration. Occasionally, individual data points may be removed if they are later found to be incorrect due to equipment issues. Negative numbers may appear when the daily zero check has not yet been applied.
Disclaimer
The Live Air Data Map combines information from multiple environmental data providers. Near real-time observations, forecasts, model outputs, and sensor measurements may not have undergone full quality assurance and quality control procedures. Data are provided for informational and educational purposes only and should not be used for regulatory, compliance, legal, or emergency response decisions. While reasonable efforts are made to ensure data quality and system availability, no warranty is expressed or implied regarding the completeness, accuracy, reliability, or suitability of information presented on this website.
Data Sources
Data Sources
| Source | Type | Used for | Update frequency | Coverage |
|---|---|---|---|---|
| Alberta Environment and Protected Areas (AEPA) | Government monitoring | AQHI, pollutant measurements, station metadata | Varies / near real-time | Alberta |
| Environment and Climate Change Canada (ECCC) | Government monitoring & forecasting | AQHI, weather, forecasts, health messaging | Varies / near real-time | Canada |
| PurpleAir | Community sensor network | Supplemental PM2.5 measurements | Near real-time | Varies |
| MSC HRDPS | Atmospheric model | Wind, temperature, humidity, atmospheric conditions | Multiple forecast cycles daily | Canada |
| MSC GeoMet / Datamart | Meteorological services | Weather observations and forecasts | Varies | Canada |
| Open-Meteo | Weather service | Supplemental weather/forecast data | Varies | Global |
| FireSmoke Canada / BlueSky Canada | Smoke forecasting | Wildfire smoke and PM2.5 guidance | Varies | Canada |
| Canadian Wildland Fire Information System (CWFIS) | Wildfire information | Fire activity and related products | Varies | Canada |
| NOAA GOES-West | Satellite imagery | Smoke and atmospheric conditions | Near real-time | Western North America |
| Government of Alberta | Geospatial data | Boundaries and geographic context | Varies | Alberta |
| OpenStreetMap | Geographic data | Roads, places and map context | Continuously updated | Global |
The map interface uses Leaflet and other open-source geospatial technologies to display and process geographic information. These technologies support the map experience but are not sources of air quality measurements.
Educational Resources
Air Quality Materials for Schools and Communities
Plain-language guides, fact sheets and printable resources on air quality in Alberta. Whether you’re looking for something to share with your family, use in a classroom or hand out at a community event you can find it here. All resources are free to download.
Healthy Communities Need Clean Air Poster
Printable school poster on pollution.
Clean Air Champion Activity Card
Printable school activity card.
Grade 5 & 6: What’s Weather and Climate Got to Do with It?
Slideshow, teacher guide, and Jeopardy game. Available in English & French.
Grade 9: From Emissions to Exposure
Slideshow and teacher guide.
Grade 12: Air Quality 101
Slideshow, teacher guide and script.
Vermicomposting with Red Wiggler Worms
How-to vermicomposting info sheet.
Mindless Idling Zombie Colouring Bookmark
Printable colouring bookmark.
Idle-Free Facts & References
Facts and reference links on the costs of idling.
Showing 8 of 20
Watch and Learn About Air Quality
Short, clear videos explaining how air quality monitoring works, what the AQHI means and how to protect yourself during poor air quality events.
 00:54
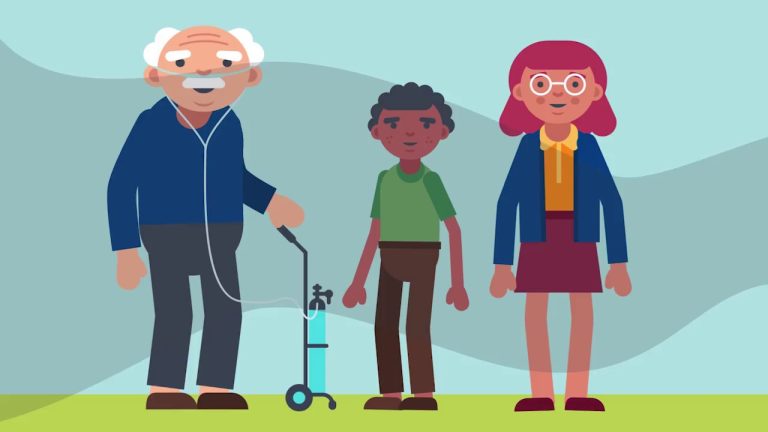
Healthy Communities Need Clean Air
Let's all do our part to keep the air we share healthy!
 01:30
Everyday Air Hero
Your everyday actions can clean up the air and make the environment healthier.
 00:55
Mindless Idling
You can contribute to healthy air quality with a simple act: reduce vehicle idling.
 01:08
Don’t Idle on the Bench
Just like a hockey player, cars warm up better when moving. Avoid needless vehicle idling.
 01:10
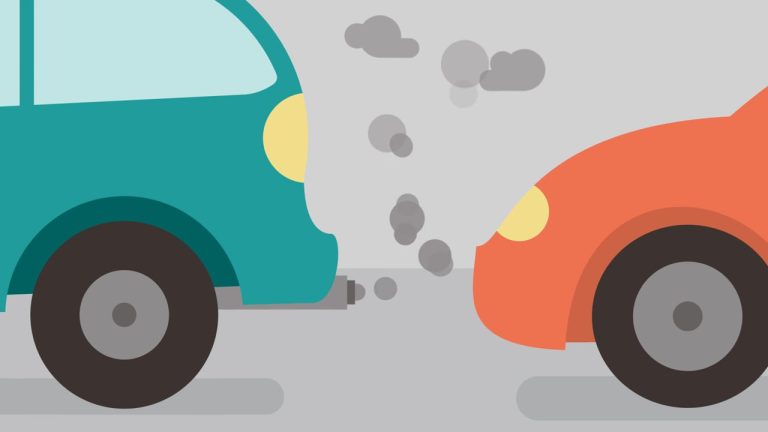
Vehicle Idling at Schools
Help keep your kids healthy: if you'll be waiting more than 10 seconds, turn off your engine.
 01:02
How Does Wildfire Smoke Affect My Health?
Learn how to protect yourself and those around you when wildfire smoke impacts air quality.